
Australian and German scientist produced a new, detailed map of the Milky Way, dubbed H14P1. The researchers used two of the world’s largest telescopes to deliver a stunning and unprecedented view of the galaxy that holds the solely known live beings in the universe.
Naomi McClure-Griffiths from the Australian National University explains the study reveals, for the first time, showed very small atomic hydrogen gas clouds between the cosmic bodies. The researchers say the gas elements helped form the stars in the Milky Way over billions of years.
The astronomers believe the results could help answer the big questions about the Milky Way and neighboring galaxies such as Andromeda. The main mystery is how does the Milky Way get the new gas it requires to keep forming stars.
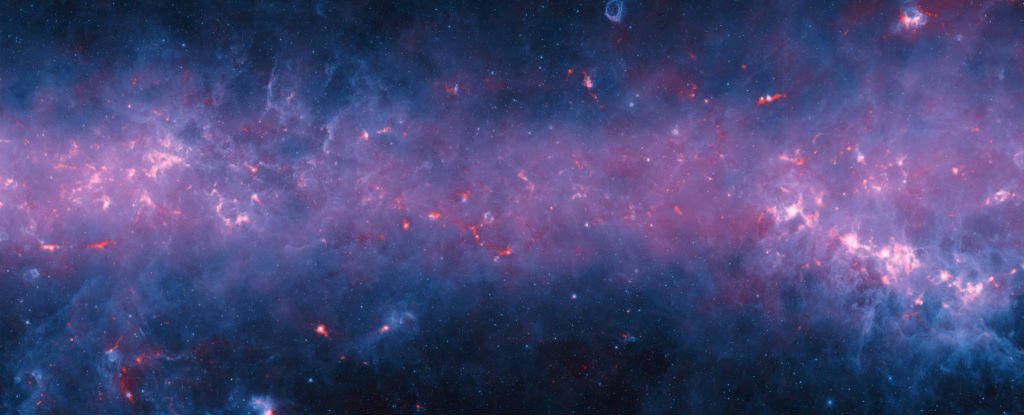
The map is a full 2D survey of the Milky Way. It shows the plane of the galaxy and what humans could see in the sky. Purple and orange colors in the map tell how much gas is present.
The HI4PI map shows vast presence of the primary galactic element
The galaxy contains up to 400 billion stars, and it has up to 1800,000 light years of distance between one far point to the other. The Solar system is around 27,000 light years from the Galactic Center, where there should be a supermassive black hole.
The HIP4I photo shows the light of neutral atomic hydrogen (HI) as the Parkes Observatory, and Effelsberg telescope captured it. Human’s host galaxy appears as the bright band across the sky with the Galactic Center in the middle.
Atomic hydrogen is the primary element in almost all astronomical entities. The abbreviation of the element is HI, and it consists of the merge between an electron with a single proton.
Scientist says hydrogen formed within the first three minutes after the Big Bang. The element allows researchers to study the evolution of the galaxy from pure gas to stars, and understand the necessary evolutionary process it involves.
It took ten years to deliver the final results of the investigation
McClure-Griffiths says the map took a “terrifyingly long time” to develop. The researchers began collecting data back in 2006, and it took five years to combine data sets from Australia’s Parkes Observatory and the Max-Planck telescope in Germany.
Advanced camera technologies made the study possible about four years ago. Both telescopes used to have one-pixel cameras, but new multi-pixel lens made the process far better. It shorted the Australian survey from 26 years to two.
Source: HI4PI


